Mini-Project #3
|

|
This page describes mini-project #3 for Computer
Networks.
Simulation is very useful tool for predicting the performance of computer
networks (and computer systems in general) and for serving as a tool to
engineer better systems. In this project you will use simulation as a tool
to develop and evaluate an algorithm for trading-off performance and energy
consumption in a given system. This mini-project may be completed in
pairs (two students) or individually with help only to be given by the
instructor.
Scenario
Consider a switch connecting an internal network (Network #1) to an external
network (Network #2). The internal network has a 1 Gb/s link, the connection
to the external network is via a 100 Mb/s or 1 Gb/s link. Figure 1 shows the
configuration.
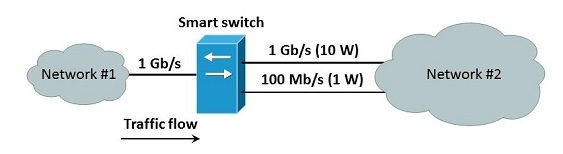
Figure 1 - Connection of an internal network (Network #1) to an
external network (Network #2)
If the offered load (link utilization) is low on the internal 1 Gb/s link,
then the 100 Mb/s external link is sufficient to carry the traffic. When
offered load is high, the 100 Mb/s link may not be sufficient (that is,
queueing delays in the switch will be unacceptable) and then the 1 Gb/s link
should be used. Assume that the 100 Mb/s link draws 1 W and the 1 Gb/s
link draws 10 W (and that both links can be placed into a 0 W sleep mode).
Also assume that the switch is "smart" and can forward traffic via either
the 100 Mb/s link or the 1 Gb/s link. Your challenge is to model the
system and develop the "smarts" to determine when to forward traffic on
the 100 Mb/s link or the 1 Gb/s link (and thus putting the unused link
to sleep). The trade-off here is one of delay versus energy consumed.
Parameters
The parameters for this system (and your model) are as follows:
- Packet length is fixed at 1500 bytes
- Packet interarrivals are from two distributions (you are to model
both):
- Exponential
- Hyperexponential with Coefficient of Variation (CoV) of 2.0
- The offered load range of interest is from 1% to 15% measured on the
internal 1 Gb/s link (so, from 10 Mb/s to 150 Mb/s data rate).
- The switch-over time (that is, wake-to-sleep and sleep-to-wake transition
time) between the two links is 0 seconds, but once a link is put into operation
it must remain in use (and powered on) for a minimum of 100 milliseconds. Only
one link at a time may be powered-on and in use.
- Each link has its own queue (assume that any out-of-order packet delivery
is somehow handled at the receiver).
- The switch can measure internal state including (but not limited to) the
number of packets in a queue and number of packets arrived in a previous time
period. It is this internal state that can be used to determine when to use the
100 Mb/s link or the 1 Gb/s link.
- The delay threshold (which much not be exceeded) is 99% of packets
must have less than 1 millisecond delay in any given non-overlapping
1 hour of operation.
Problem
You are to model the above system and invent an algorithm to determine when
to use the 100 Mb/s and 1 Gb/s external links such that the delay threshold
is maintained and energy use (which can be measured as average power draw) is
minimized. For your model you are to do the following:
- Plot the mean delay, 99%-tile delay, and average power draw as a function
of offered load (with offered load ranging from 1% to 15% in increments of 1%)
for each interarrival time distribution (this for one hour of simulated run time
and 99% of packet delays must be less than 1 millisecond). Your system must be
better (that is, have lower average power draw for, at least, most offered loads)
than the results given here.
- Formally describe your algorithm for determining when to use the 100 Mb/s
and 1 Gb/s link. You can review any Algorithms textbook to help you remember
how to describe an algorithm. You should provide a table of constants,
variables, and external functions as needed to understand your algorithm.
Requirements on the algorithm
Your algorithm or method for determining when to use the 1 Mb/s or 1 Gb/s link
is the "fun part" of this mini-project. Your algorithm may use any state
information that you can collect in the modeled smart switch. You cannot know
apriori the distribution of interarrival times (but, you could sample and
estimate the distribution if you thought this would be useful). You cannot know
apriori the offered load (but, you can sample and estimate it - this would
probably be useful). The algorithm cannot be "tuned" for each offered load or
distribution (but, it may be self-tuning).
Deliverables
Each student, or pair of students, will deliver the following:
- The source code for the simulation model in buildable form (so that the
results can be reproduced). The simulation model should use the skeleton given
here (especially the output section), unless
there is some really good reason not to do so (which must be discussed with
me before final submission).
- Graphs for item (1) in the Problem statement above.
- The mean delay and average power draw for offered load of 5% for the two
given interarrival time distribution (where the 99% delay must be less than
1 millisecond). The student(s) with the best result (where the system must
correctly meet the specified parameters) will receive a prize. What defines
the best result?
- Algorithm description for item (2) in the Problem statement above.
Grading
Grading is as follows:
- Correctness of the simulation model -- 50 points
- The feasibility and "goodness" of the algorithm -- 25 points
- Note that if the algorithm is invalid (that is, it does not meet the
algorithm requirements noted above) then the grade will suffer
- Results presented are better than the base model -- 25 points
- Note that if the model is incorrect (that is, it does not meet the
system parameters) then the grade will suffer
Extra credit will be given if the student(s) can provide an analysis to prove
that their algorithm works (that is, that their algorithm is not just a
heuristic). Points can (and will) be deducted for sloppy graphs and/or
sloppy/unclear description of your algorithm.
Notes, advice, and hints
Some notes:
- A short primer on plotting numerical or experimental data is
here.
- Coding style matters, my style guide is
here.
If you have another style guide you follow, please share it with me.
|
Last update on November 5, 2014
|