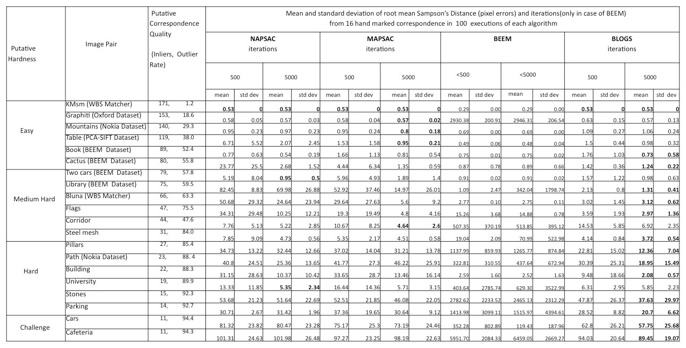
Comparative performance analysis of NAPSAC, MAPSAC, BEEM and BLOGS (our method). The first column lists the classification of the image pairs according to putative hardness. The second column lists the image pairs. The third column notes the number of inlier correspondences and outlier rates in putative correspondence set for each image pair. This was manually determined. It captures the putative ``hardness'' of each image pair. The images are sorted in the table based on this. For each algorithm we list the mean and standard deviation of the root mean Sampson's distance for the 16 ground truth correspondences for different number of iterations.